The sound study
As you might remember in our first post about ‘PA Design – Sound Studies’ we mentioned the needed data for the first step. For a real sound study we need further data in addition to the existing information.
Noise map
Basis of all calculations is the so-called noise map. The noise map can be generated in two ways; either to measure it with calibrated noise level meters or to compute it with a noise mapping / noise prediction software program.
The noise measurement can only be established on industrial plants if all machines and installations are in operation. The software calculation can only be executed if the data of all machines, buildings, structures, etc. is available. The calculation of noise maps can also be carried out by the customer or another 3rd party company.
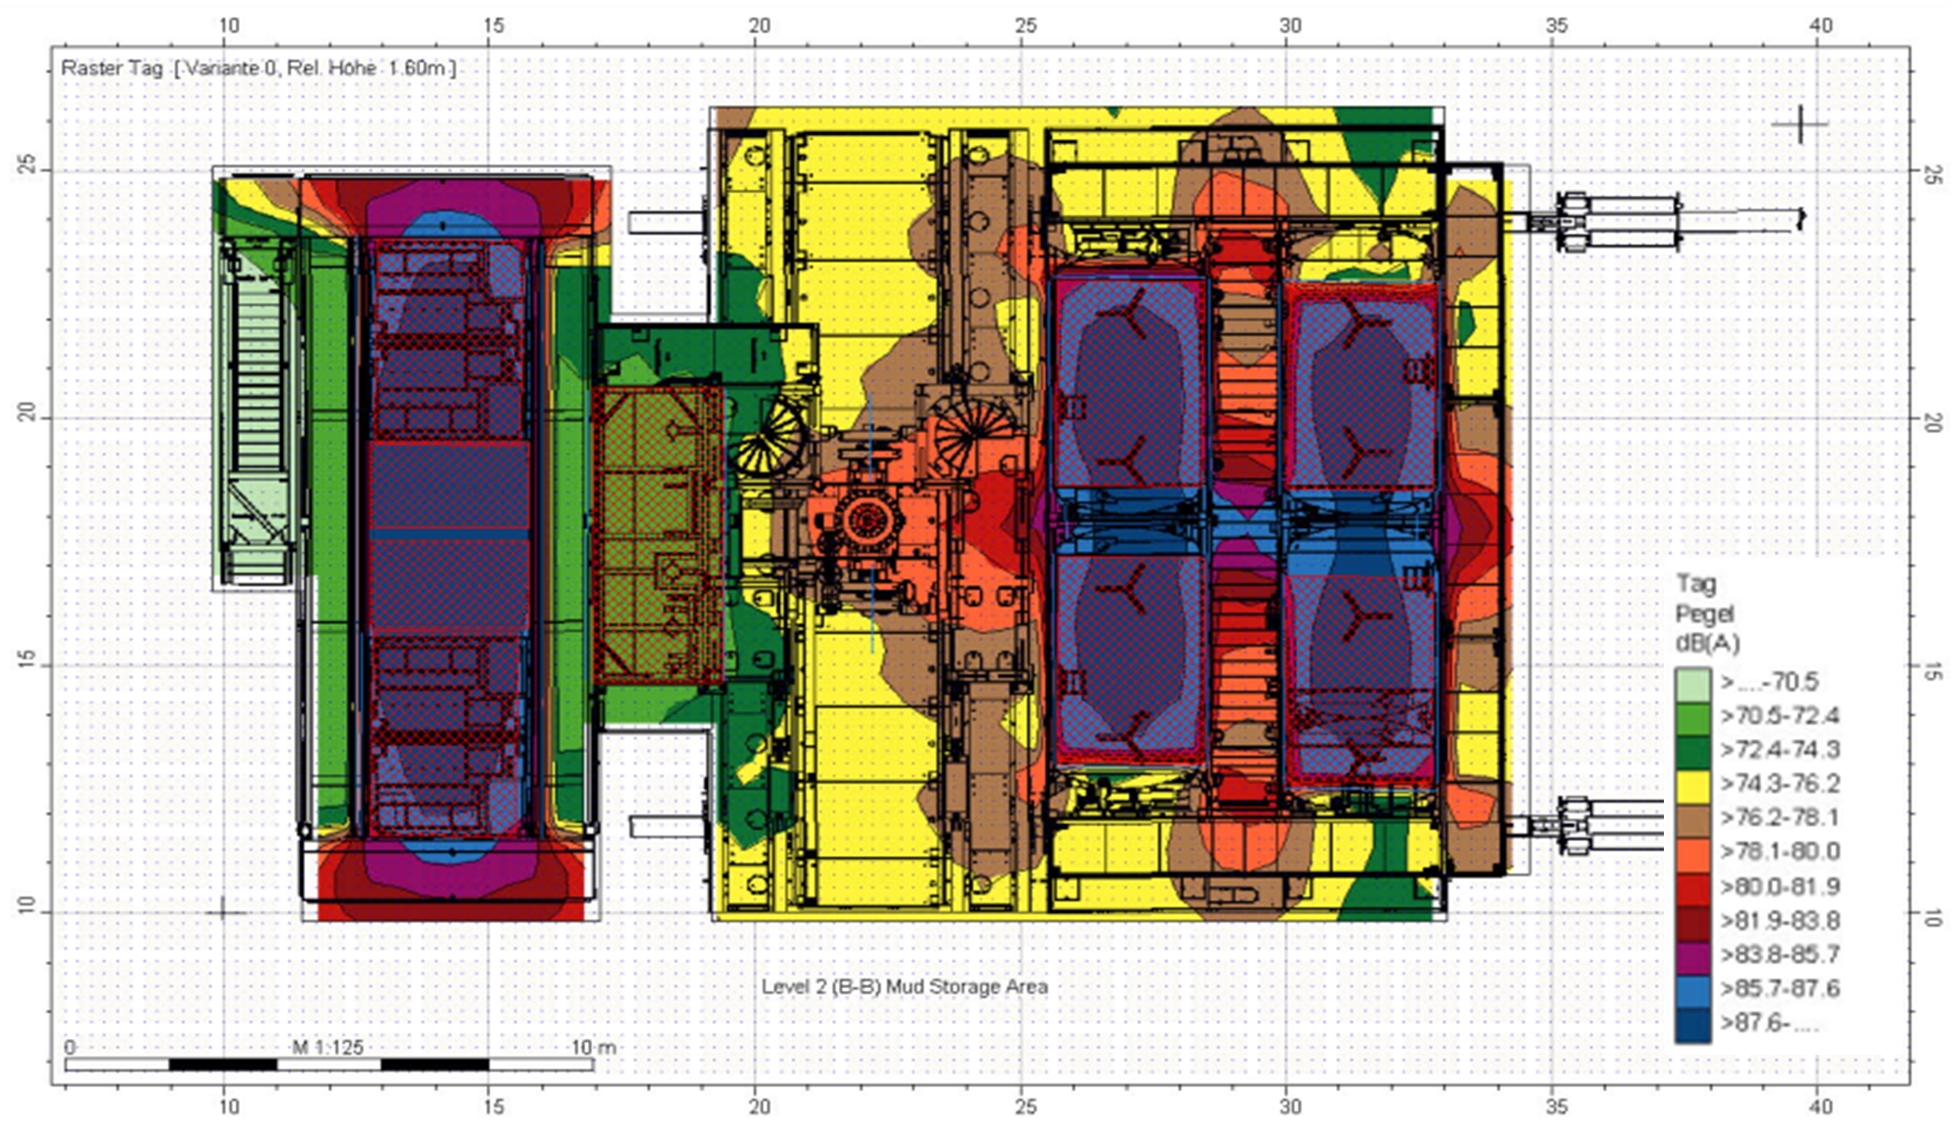
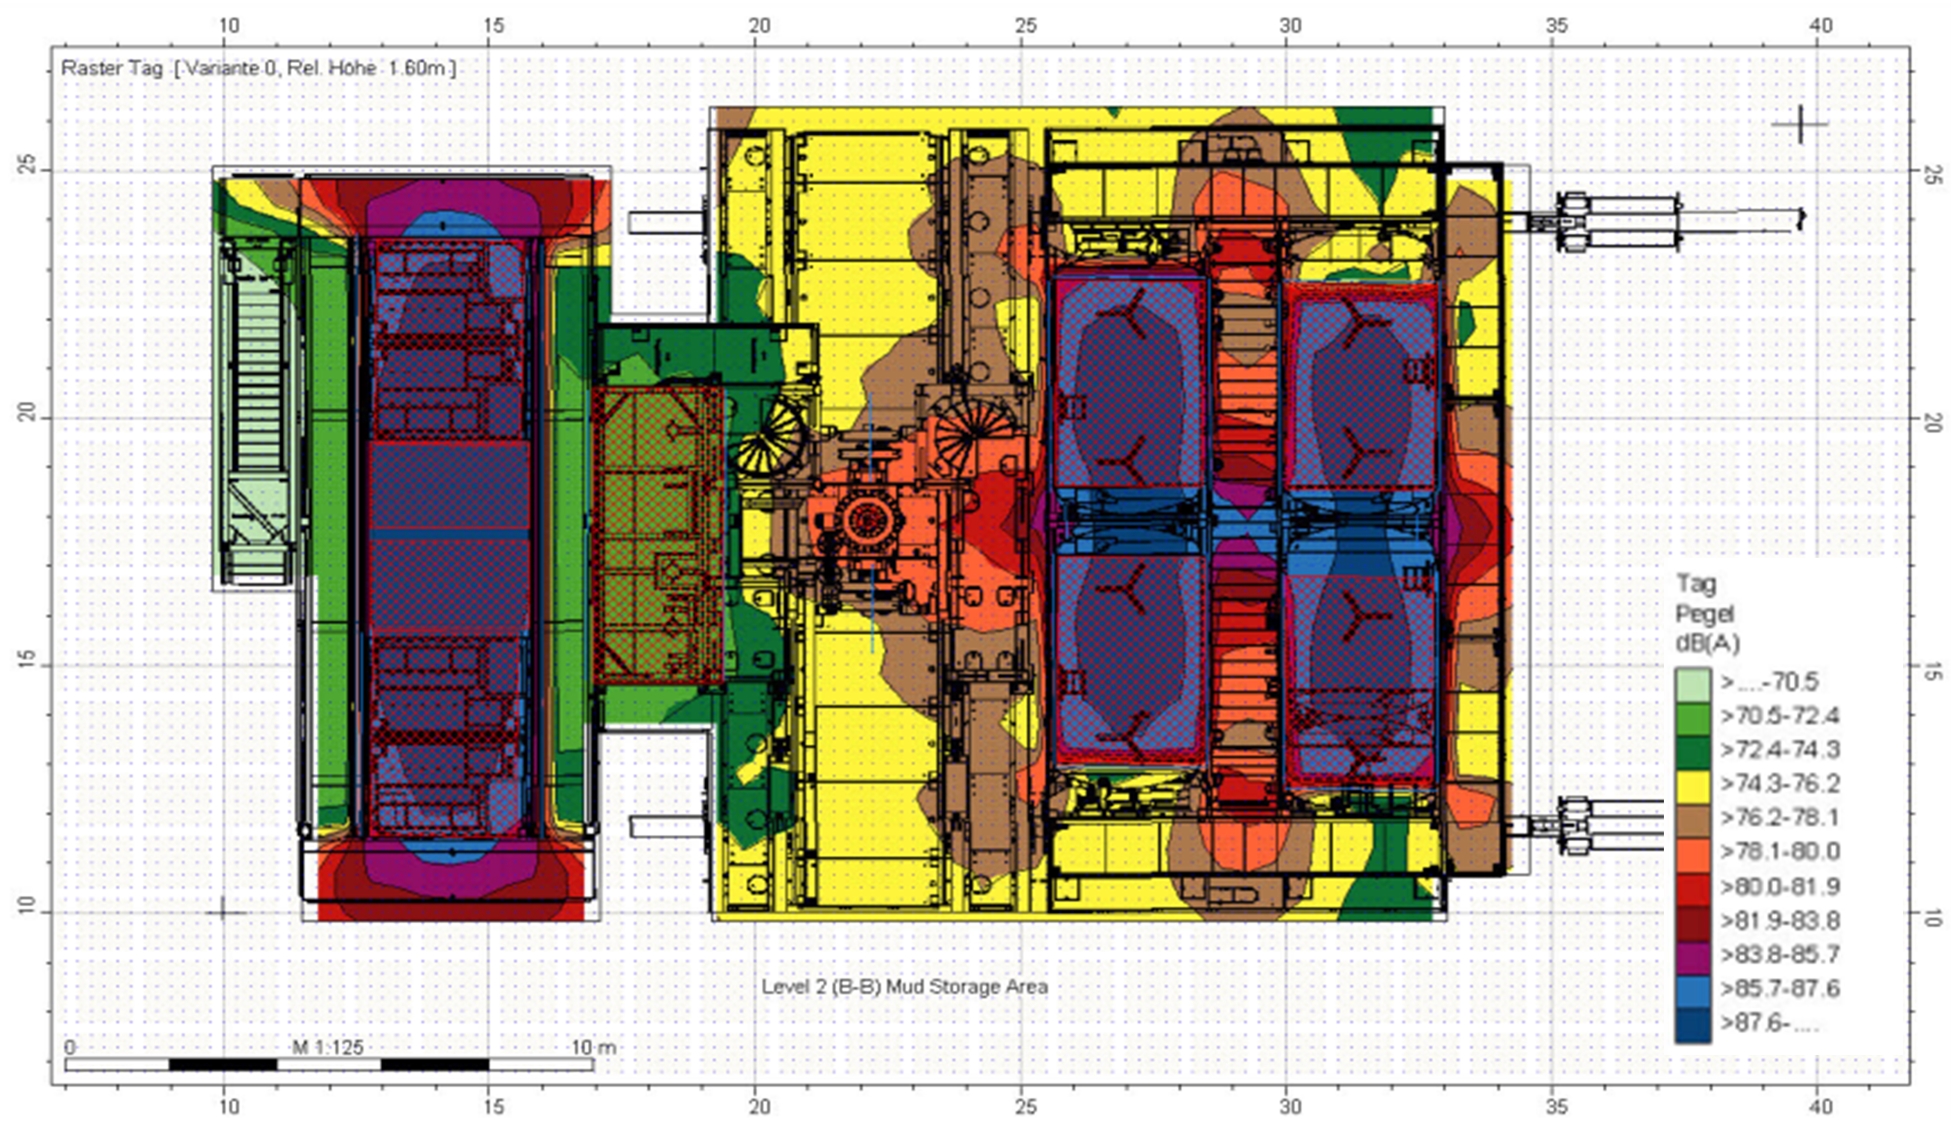
A typical noise map looks like this one:

We can see different kind of noise sources (surface, point and/or line source).
Housings, buildings and other structures are also visible.
Different colors mean different noise levels.
The noise map – Import or rebuild
The most labor-saving method is if the noise prediction software has an export filter for our calculation software. In this case we can quickly import the noise map and continue with the proper work.
If there is no export noise map data for the calculation software available we must rebuild the noise map according to the supplied printed paper work and documents as precisely as possible. This work is very time consuming and not easy to handle.
Where are the speakers?
After generating the noise map we can now begin with placing the speakers depending on hazardous or non-hazardous areas.
There are several rules to be observed, here are examples for the most important ones:
a) The speakers should only cover the manned areas where workers could be present.
b) We must be aware of too high sound pressure levels, e.g. above 120 dB, due to potential hearing damages.
c) At an ambient noise above 85 dB additional flashing beacons should be installed.
d) Speakers should be mounted ≥ 3 meters above ground.
e) Hazardous areas with appropriate Ex-proof speakers.
…but there are some more…
Signal to noise
After placing and aligning the speakers, we calculate the sound map and at least the signal to noise map (SNR).
The sound map represents the radiated sound of the speakers at the listening plane without noise, whereas the signal to noise ratio constitutes the result of a mathematical calculation:
(dB_Signal_Map) – (dB_Noise_Map)
The signal to noise ratio should be ≥ 10 dB and should not exceed 20-25 dB. This may differ from standard to standard, country to country, and customer to customer.
From our experience with the above mentioned ratio (SNR) – beside other factors – a good intelligibility should be met.

This picture shows above area with placed (3 meters above ground) and aligned (-30° off horizontal axis) speakers, supported by 2 flashing beacons – the signal to noise ratio shows good coverage at nearly any point.
At the end
As you can see, a lot of data and work is needed to create a sound study. But when the project team works hand in hand, a well defined PAGA system with good intelligibility is the result.